Forensics & Detection
The Forensics section is your investigation hub — it captures every call, SMS, and email to your PhantomIDs, visualizes relationships in an interactive network graph, and lets you generate forensic reports.
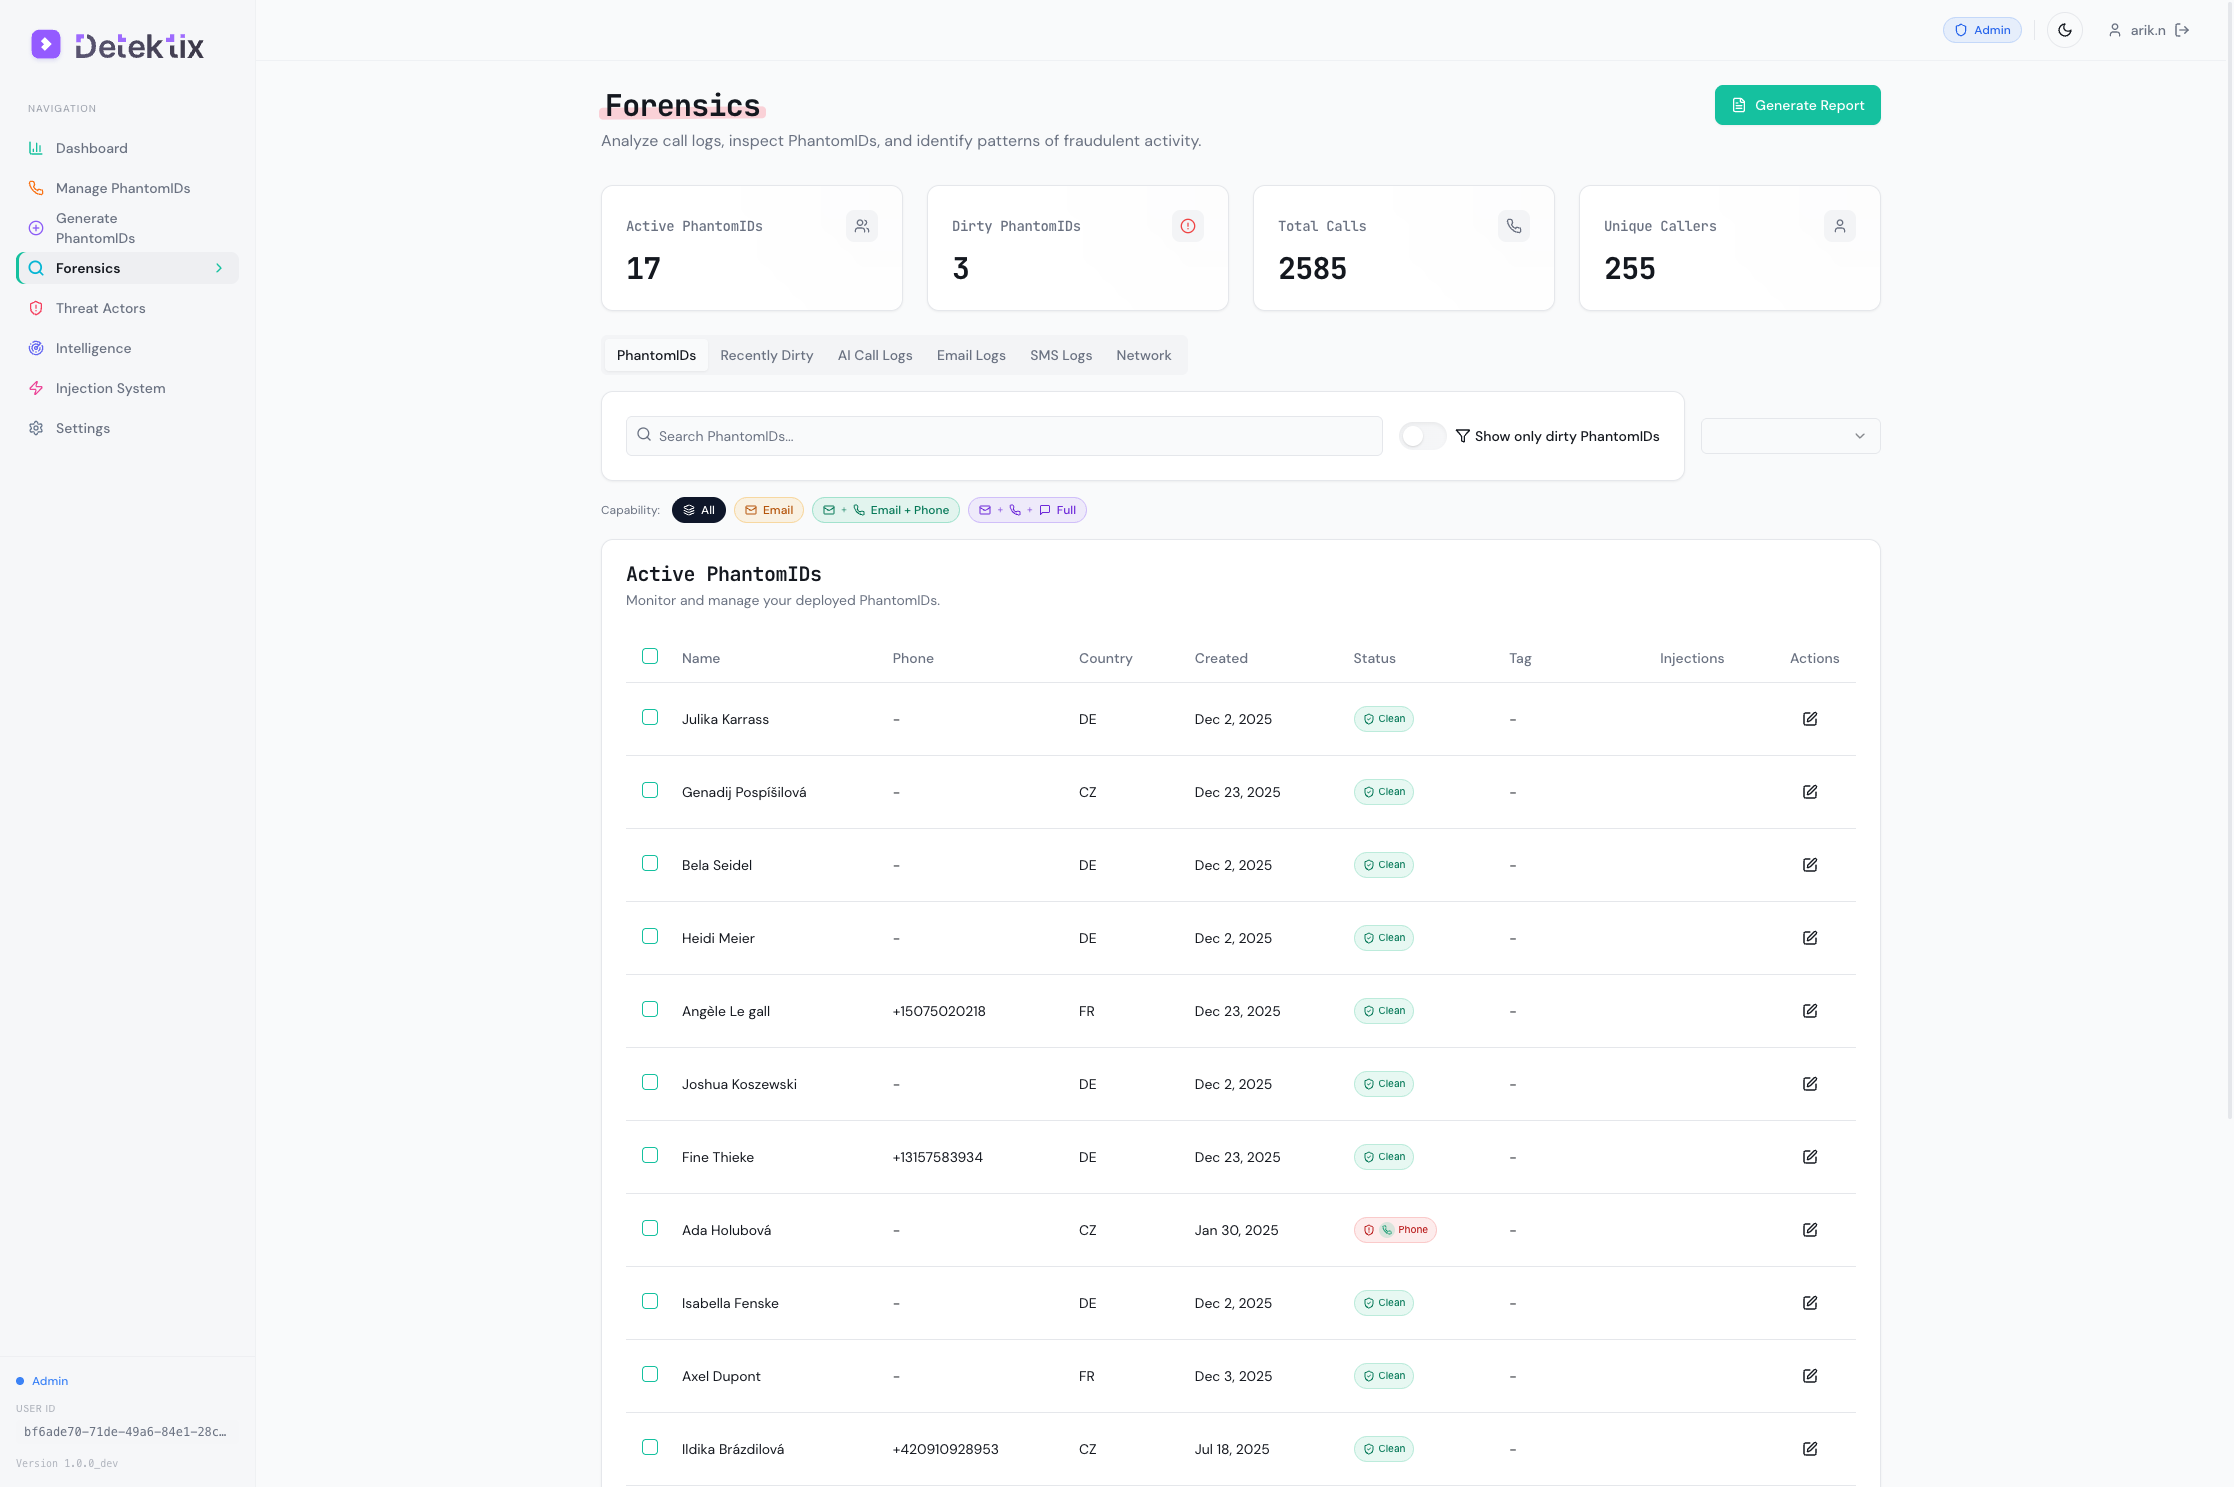
PhantomID Detail & Timeline
Click any PhantomID in the forensics table to open a detail panel showing the full identity profile and activity timeline.
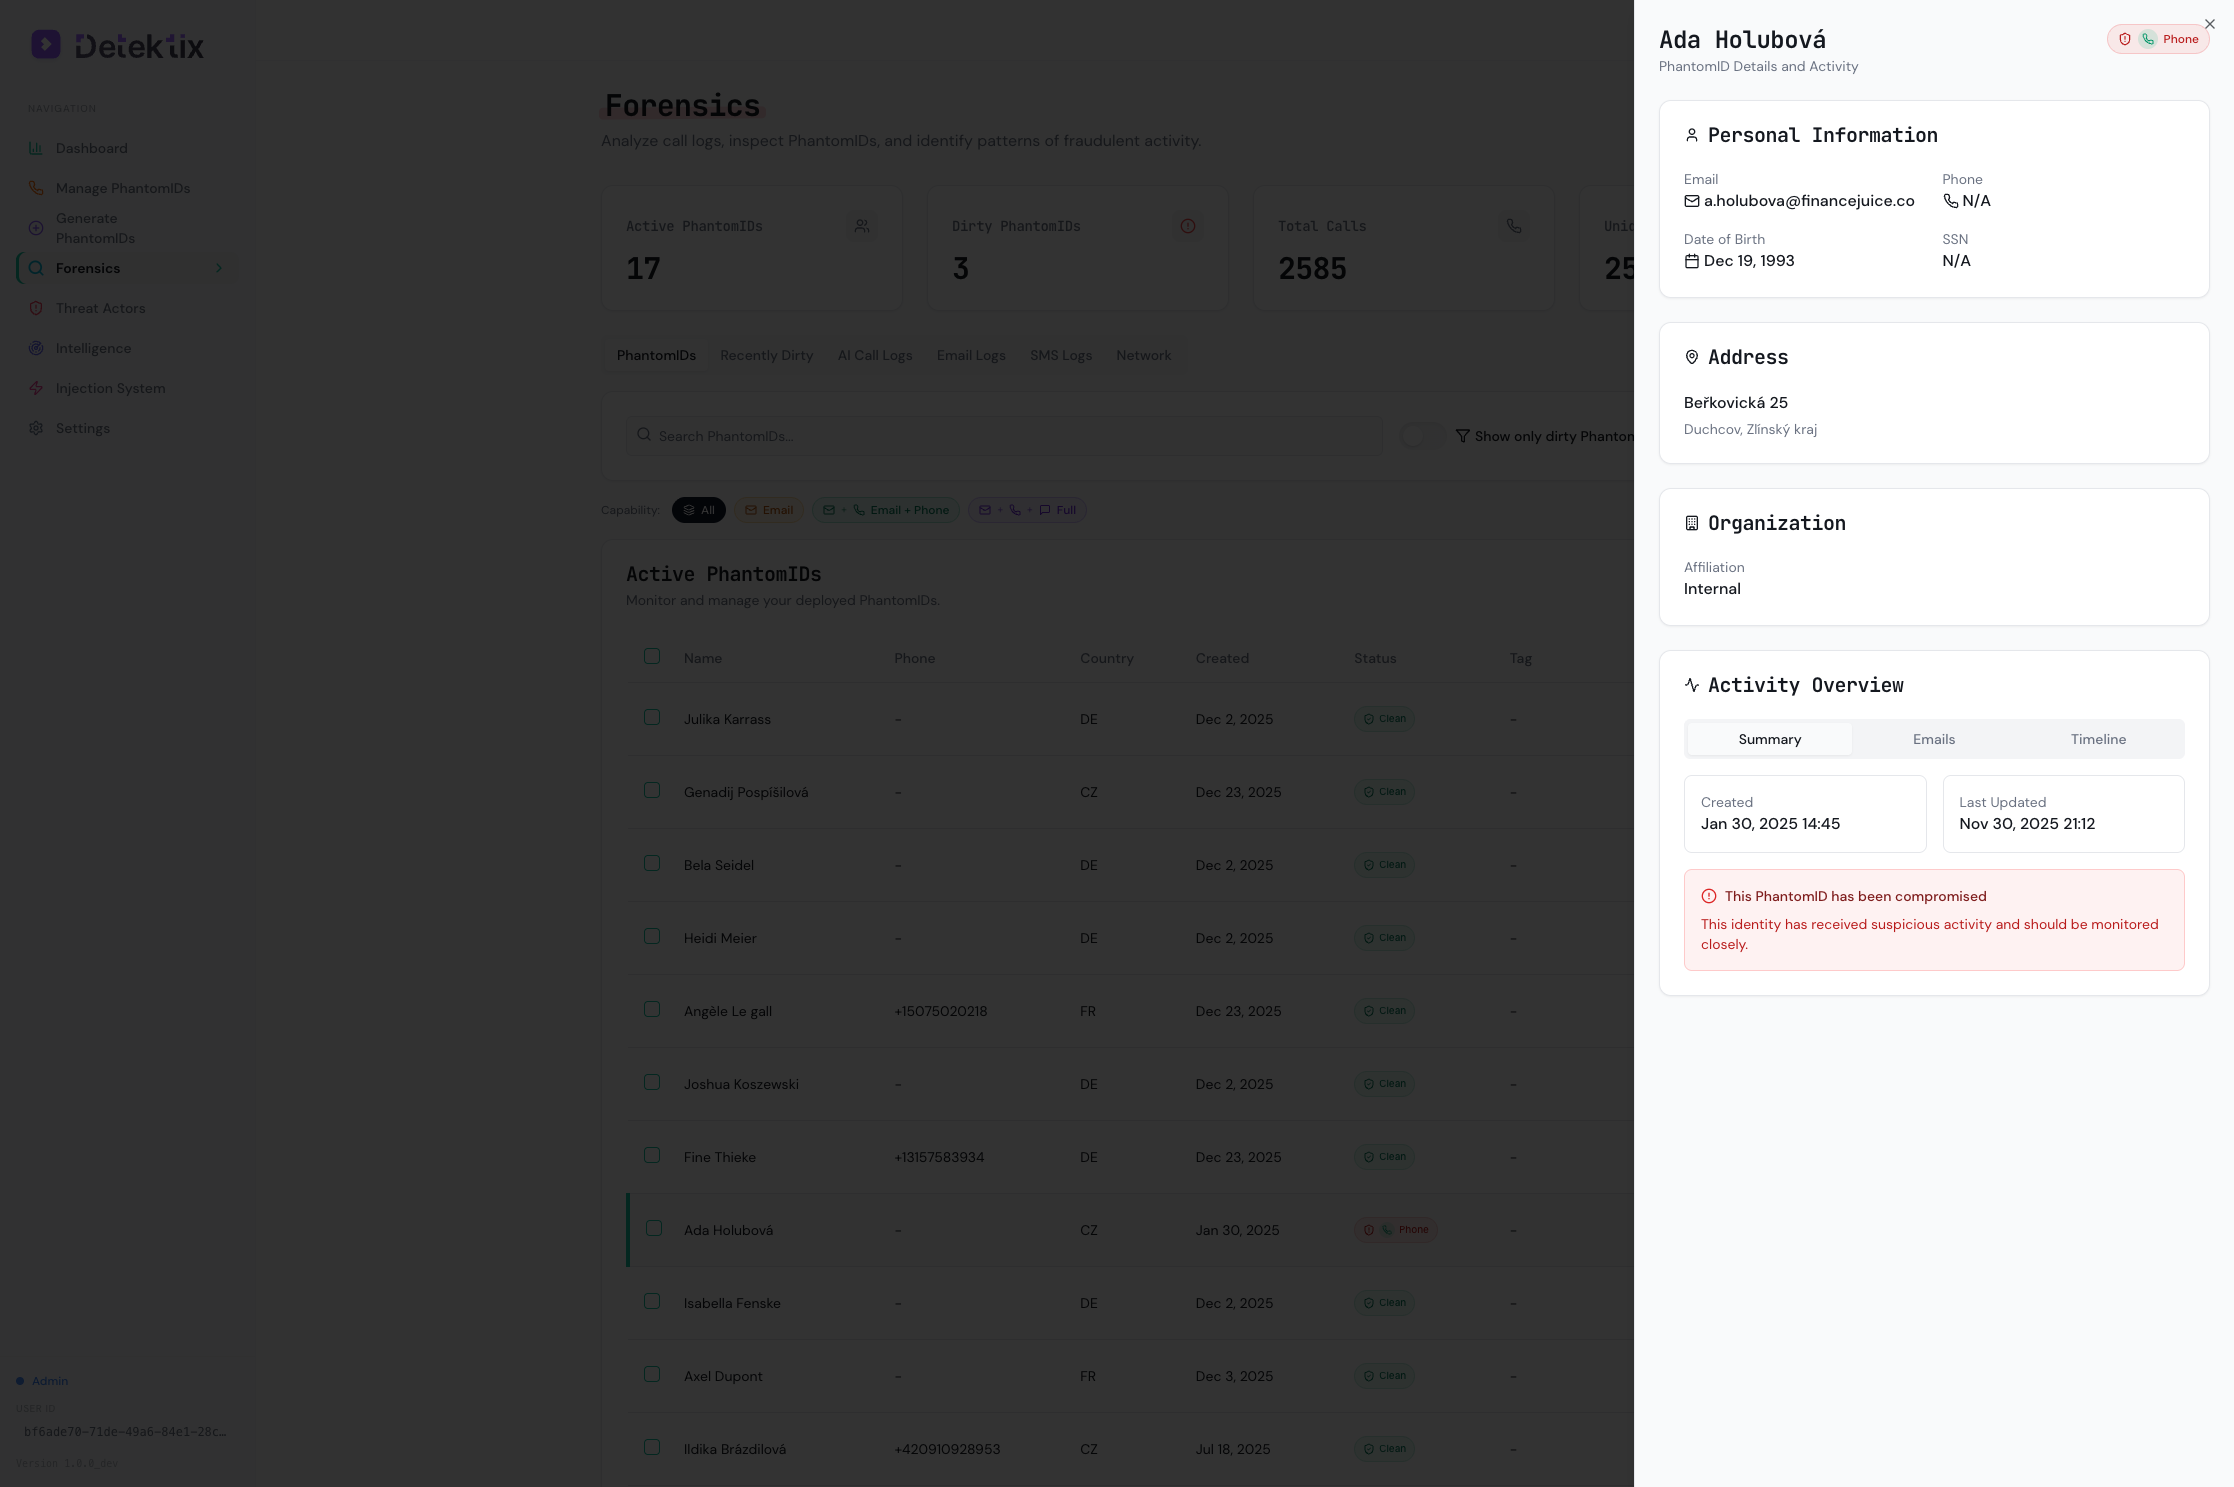
The detail panel shows:
- Personal Information — Email, phone, date of birth, and associated metadata
- Address — Full address from the PhantomID profile
- Organization — Affiliation assignment
- Activity Overview — Summary, emails, and a chronological timeline of all contacts
Forensic Timeline
The Timeline tab shows a chronological feed of every interaction with this PhantomID — calls, SMS, and emails with timestamps and source identifiers.
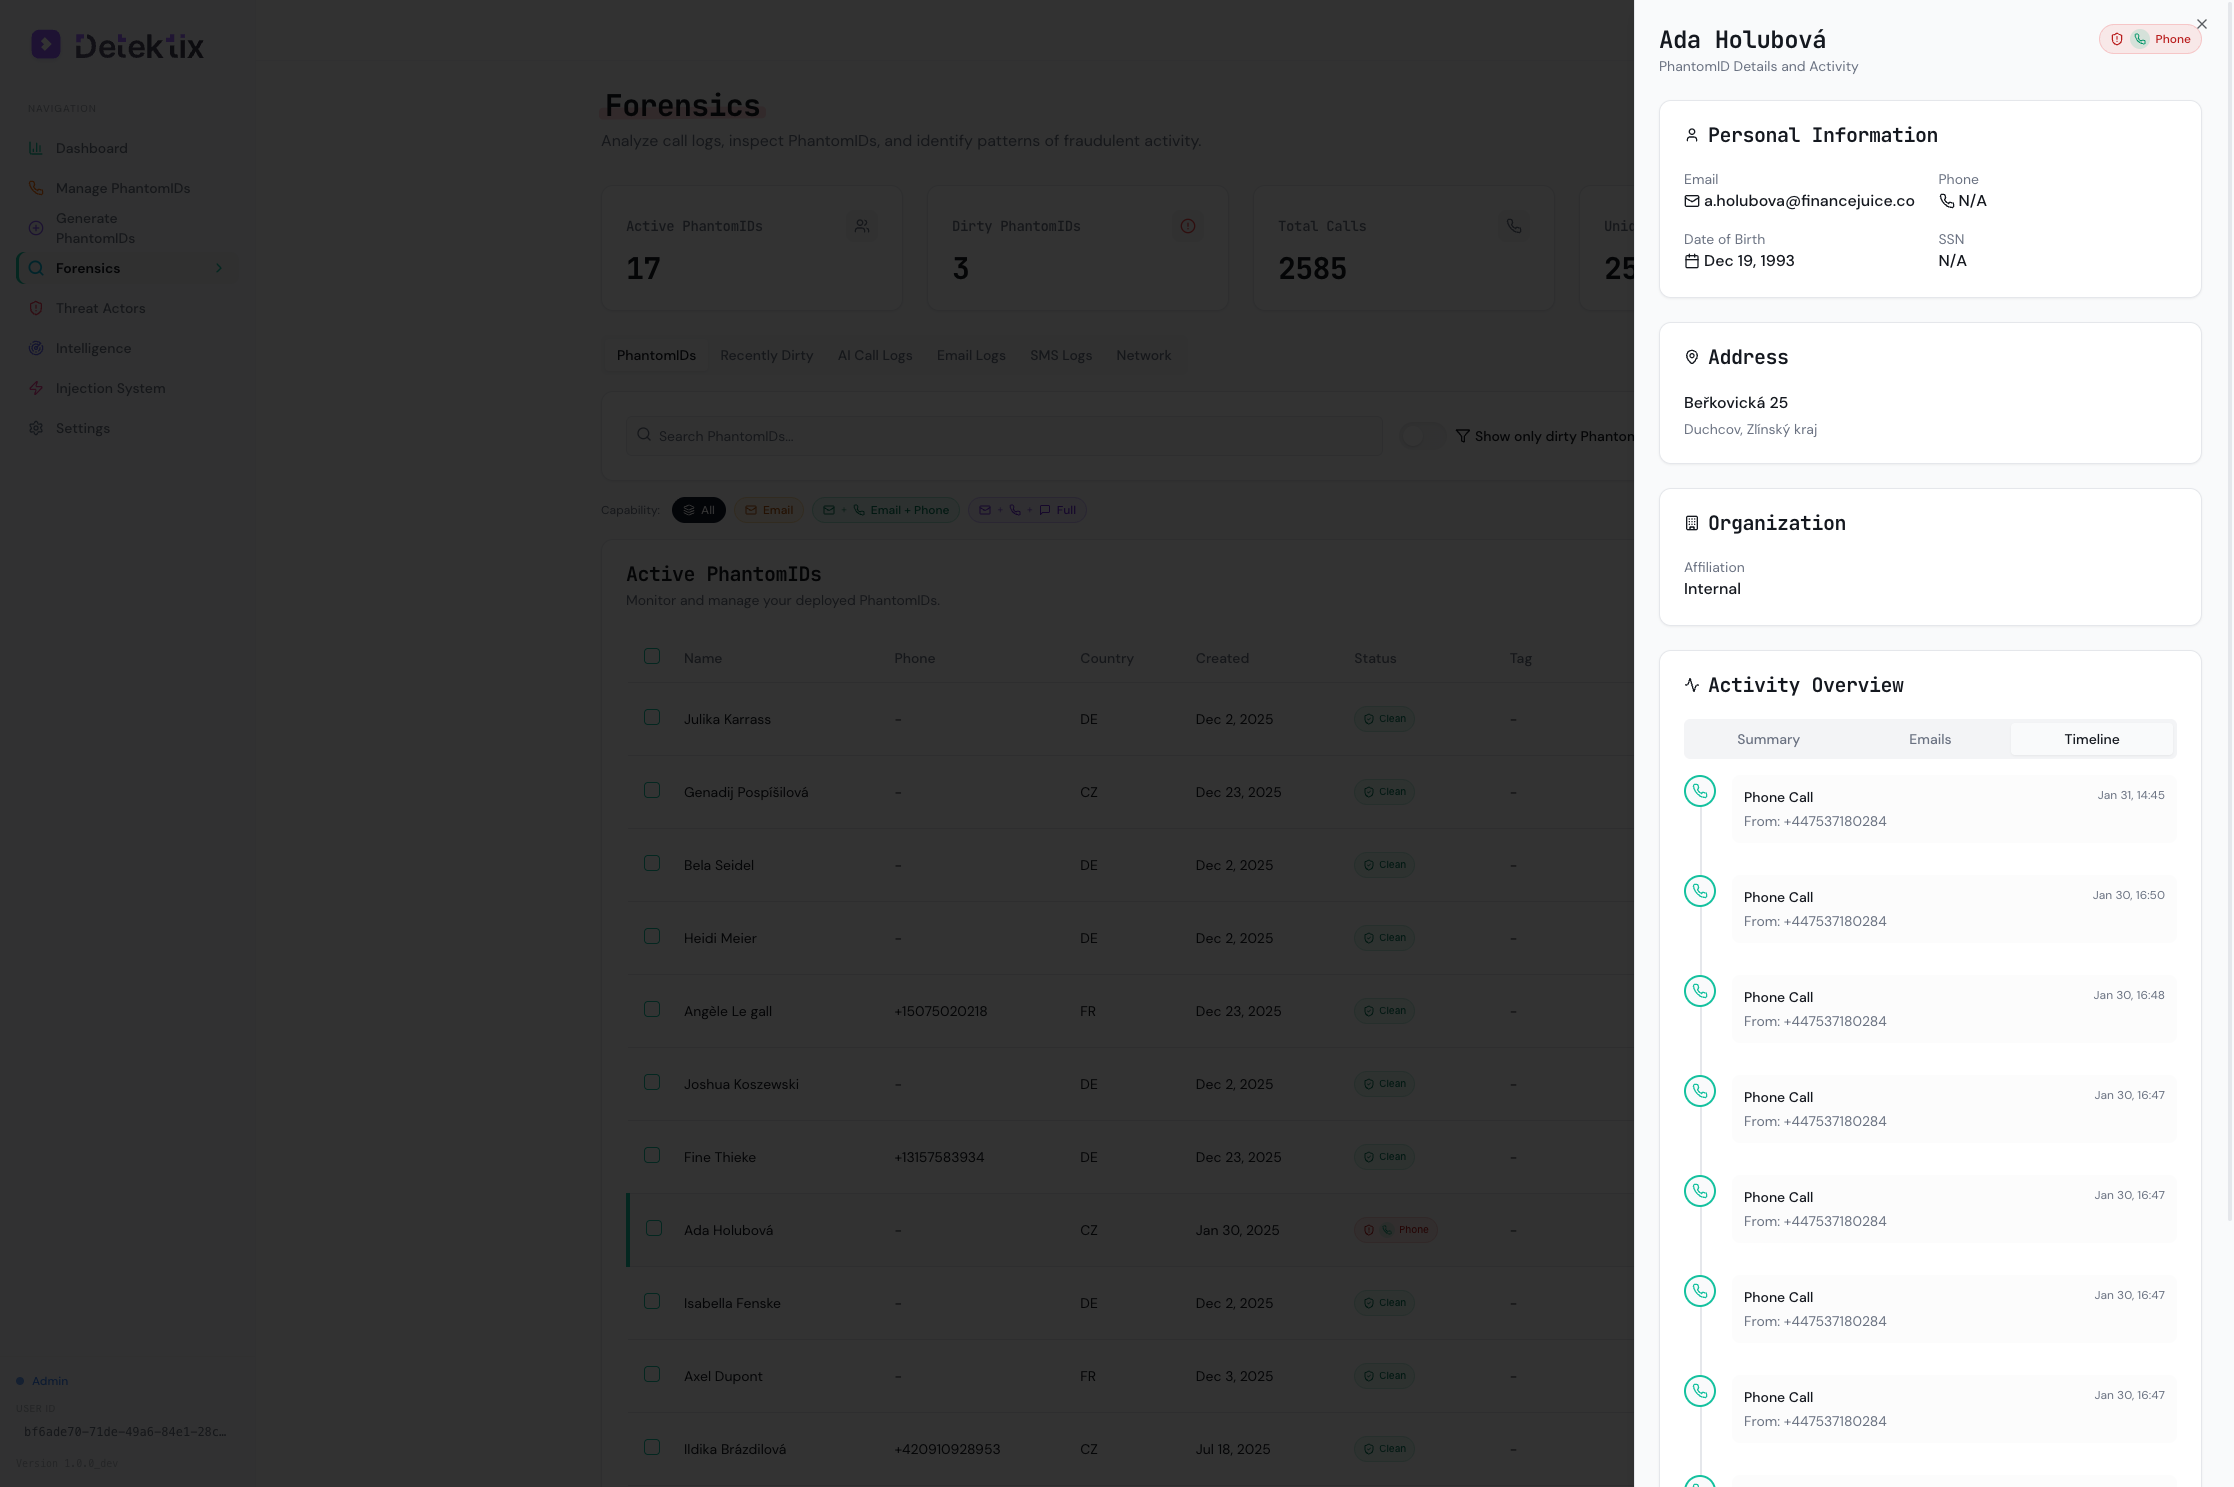
This is your primary investigation view for a single PhantomID — it answers "who contacted this identity, when, and how?"
Recently Dirty
The Recently Dirty tab tracks PhantomIDs that have transitioned from Clean to Dirty within a configurable time range. It includes a trend chart showing compromises over time and a details table with "Days Until Compromised" — how long after deployment each PhantomID was first contacted.

Call Logs
Every incoming call to a PhantomID phone number is captured and logged.
Call Log Fields
| Field | Description |
|---|---|
| From | The caller's phone number |
| To | The PhantomID phone number that was called |
| PhantomID | The identity associated with the called number |
| Direction | Inbound or outbound |
| Status | Call status (completed, no-answer, busy, failed) |
| Duration | Call length in seconds |
| Recording | Link to call recording (if available) |
| Transcript | AI-generated transcript (if AI voice agent answered) |
| Price | Telephony cost for the call |
| Affiliation | Business unit the PhantomID belongs to |
| Date/Time | When the call occurred |
Filtering Call Logs
Filter call logs by:
- Date range — Focus on a specific time period
- Affiliation — Show calls for a specific business unit
- PhantomID — Show calls to a specific identity
- Phone number — Search by caller or called number
- Status — Filter by completed, missed, etc.
Call Recordings and Transcripts
When a PhantomID is configured with an AI voice agent (via ElevenLabs), calls are:
- Answered by the AI — The voice agent engages the caller naturally
- Recorded — The full conversation is captured
- Transcribed — An AI-generated transcript is produced
This provides deep intelligence about who is calling and their intent — beyond just knowing that a call happened.
SMS Logs
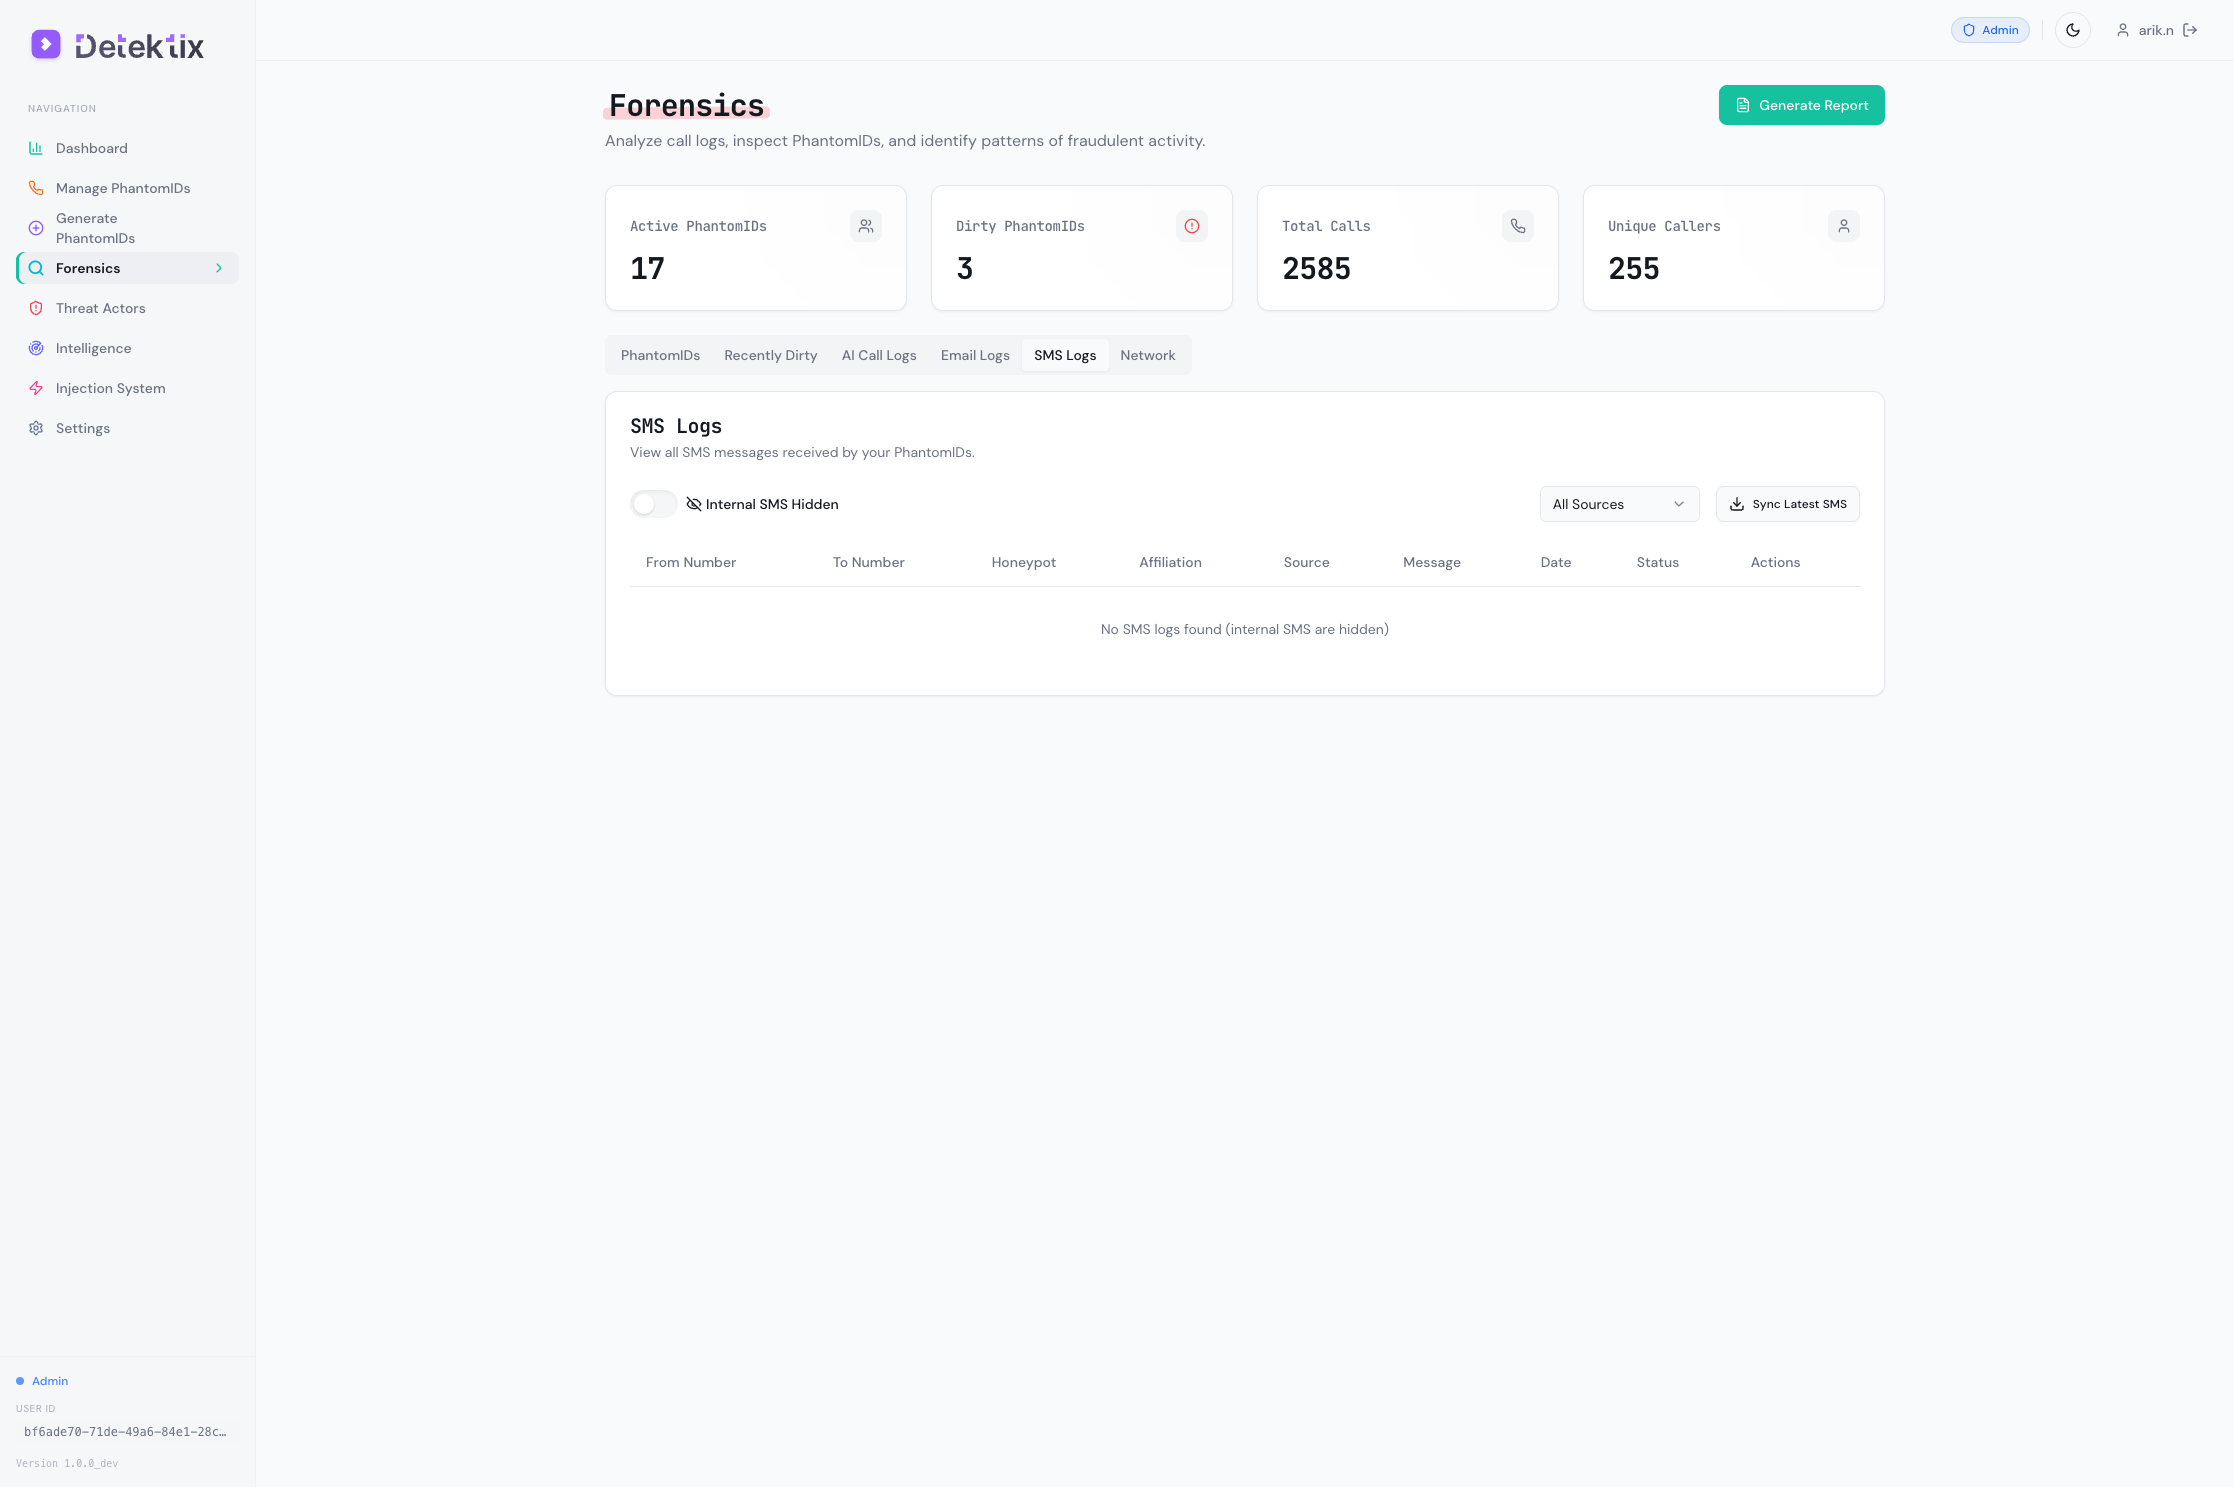
SMS messages sent to PhantomID phone numbers are captured with full content.
SMS Log Fields
| Field | Description |
|---|---|
| From | The sender's phone number |
| To | The PhantomID number that received the SMS |
| PhantomID | The identity associated with the receiving number |
| Body | Full text content of the message |
| Media | Any attached media (images, files) |
| Segments | Number of SMS segments (for long messages) |
| Price | SMS cost |
| Date/Time | When the message was received |
SMS Sources
SMS messages may arrive through different channels depending on your configuration:
- Twilio — Standard SMS delivery via Twilio numbers
- IQSIM — SMS via SIM-based gateway (if configured)
- BYOT — SMS via your own Twilio account (if configured)
All SMS messages are consolidated into a single view regardless of the delivery channel.
Email Logs
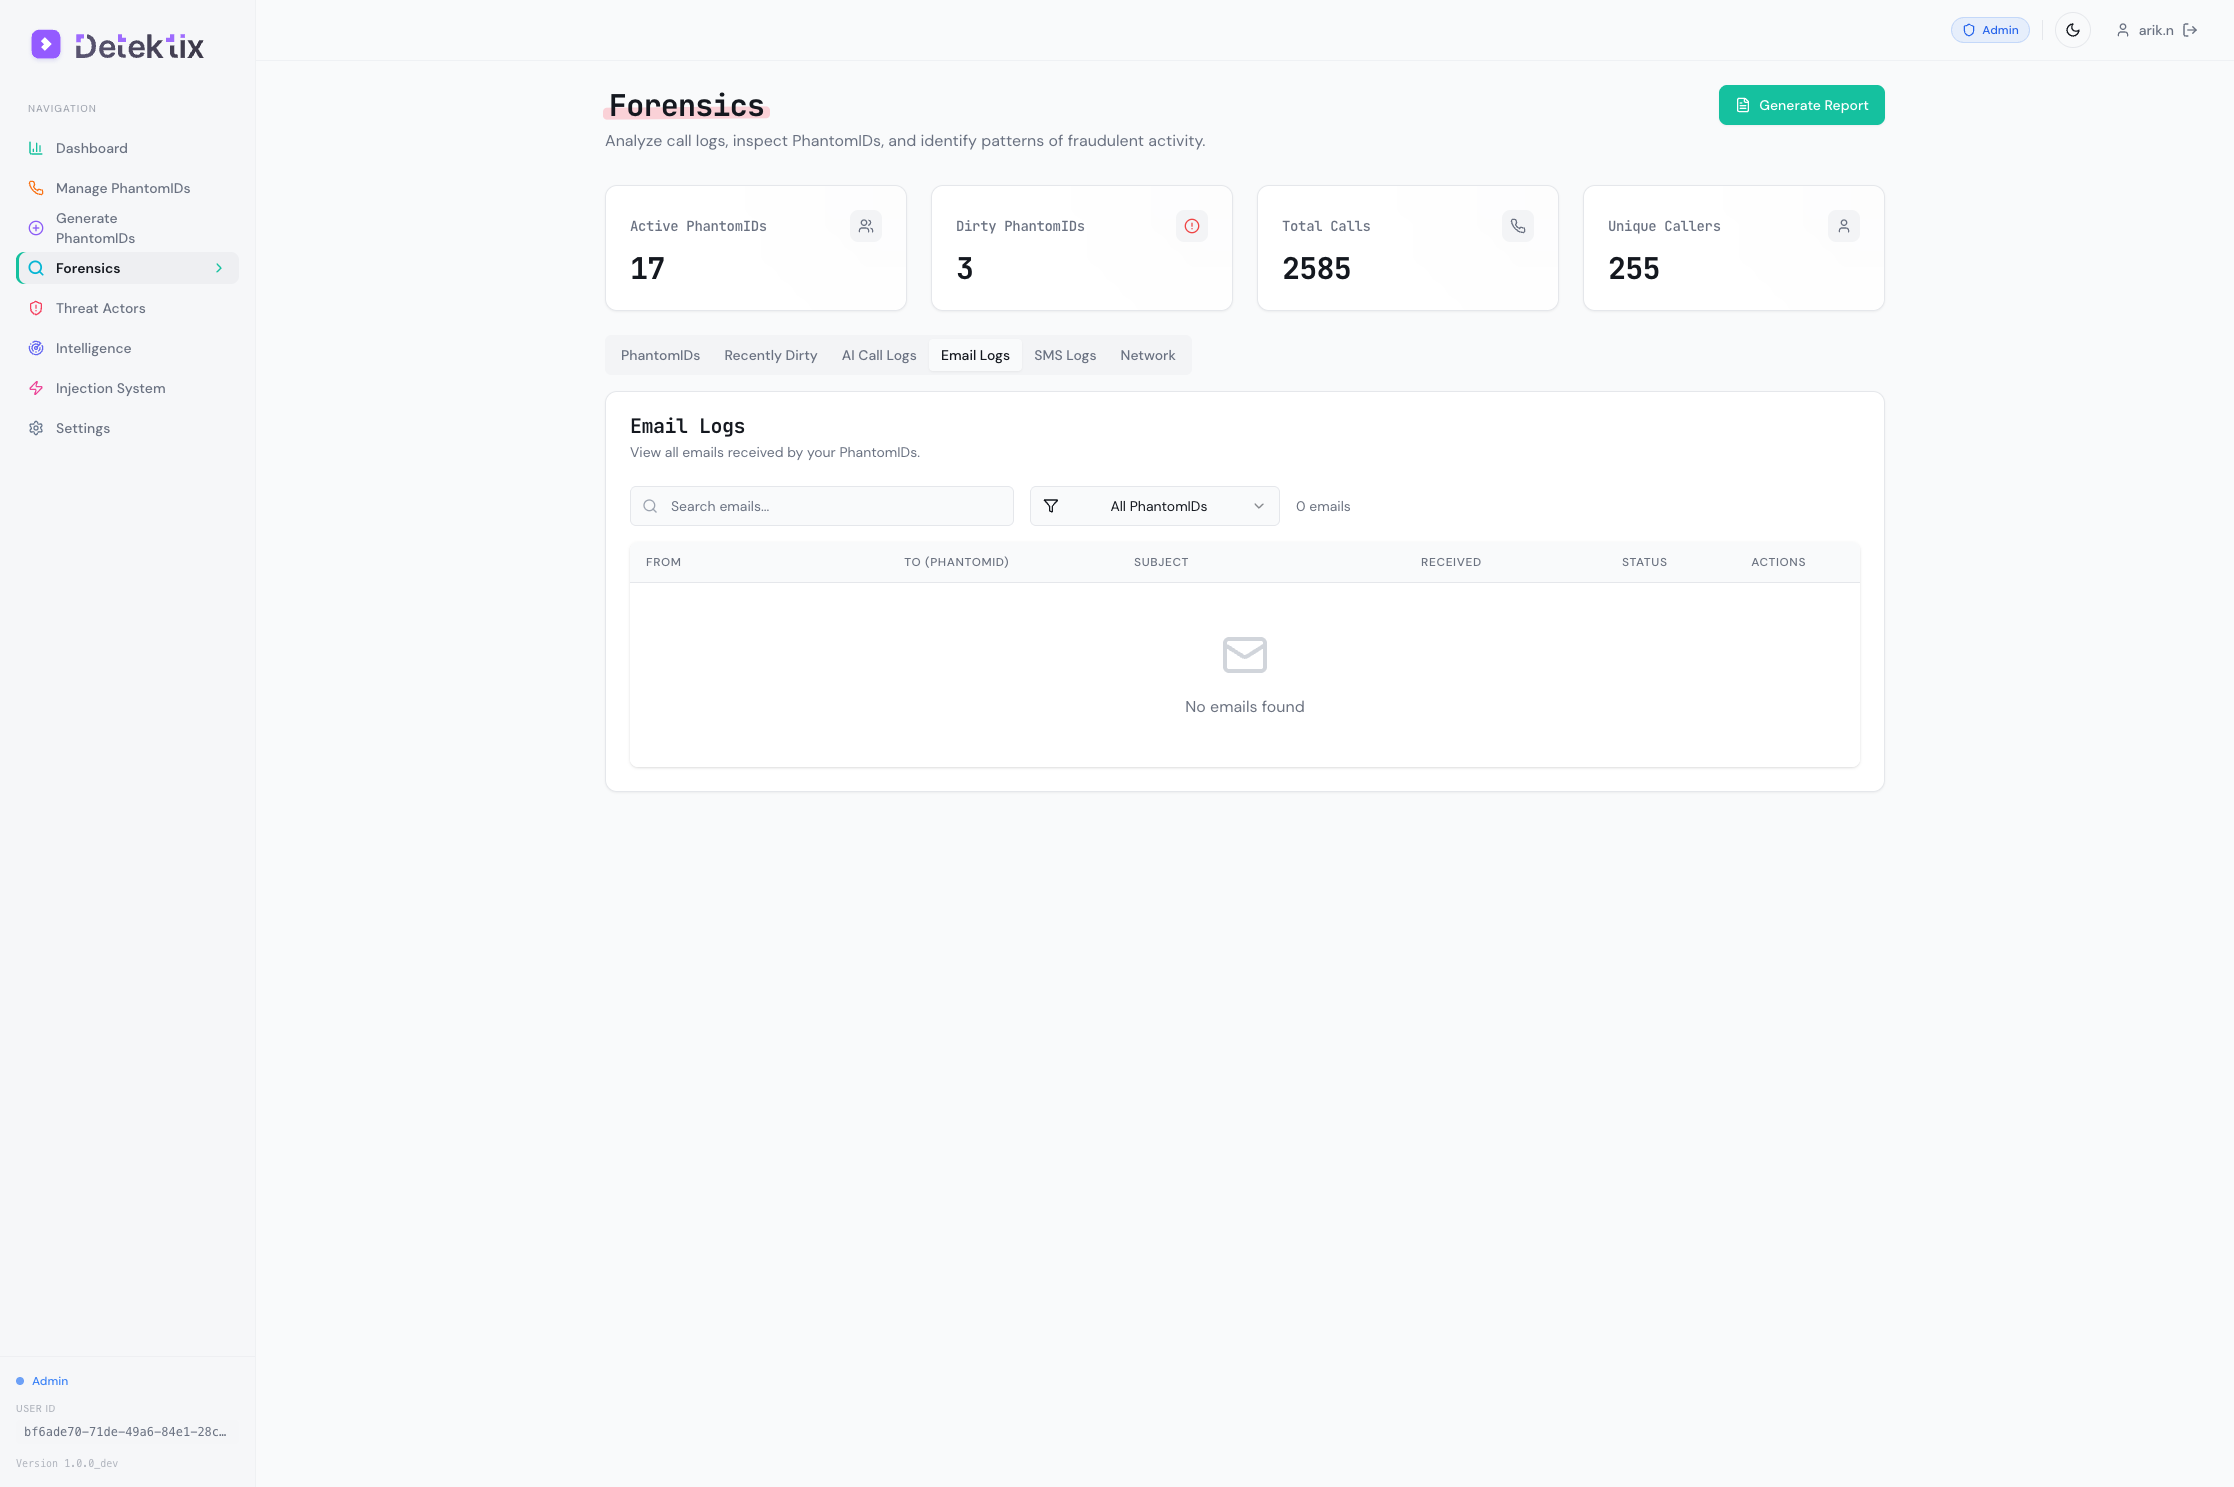
Emails sent to PhantomID email addresses are captured and stored.
Email Log Fields
| Field | Description |
|---|---|
| From | Sender's email address |
| To | The PhantomID email address |
| Subject | Email subject line |
| Body | Full email content (text and HTML) |
| Attachments | List of attached files |
| Headers | Email headers for forensic analysis |
| Suspicious | Flag indicating potentially suspicious content |
| Date/Time | When the email was received |
Email capture requires a monitored domain configured in your tenant's domain settings.
Network Graph
The network graph is an interactive visualization that maps relationships between PhantomIDs, threat actors, and communication events.
Understanding the Graph
The graph uses a force-directed layout built with D3.js:
Nodes represent entities:
- PhantomIDs — Your planted synthetic identities
- Threat actors — Detected suspicious entities
- Phone numbers — Caller phone numbers
- Email addresses — Sender email addresses
Edges represent communications:
- Calls — A phone call between two numbers
- SMS — A text message between two numbers
- Emails — An email between two addresses
What Patterns to Look For
The network graph helps you identify:
- Hub patterns — A single caller contacting many PhantomIDs (indicates systematic data access)
- Cluster patterns — Groups of callers targeting the same set of PhantomIDs (indicates coordinated activity)
- Cross-channel patterns — The same entity contacting PhantomIDs via multiple channels (call + SMS + email)
- Temporal patterns — Bursts of activity within a short timeframe
Interacting with the Graph
- Zoom — Scroll to zoom in/out
- Pan — Click and drag the background to pan
- Select nodes — Click a node to highlight its connections
- Filter — Use controls to show/hide specific node types or communication channels
- Timeframe — Adjust the time range to focus the visualization
Start with the broadest view to identify major clusters, then zoom into specific threat actors or PhantomIDs for detailed investigation.
Generating Reports
Detektix can generate forensic HTML reports that compile investigation data into a shareable format.
Report Contents
A generated report typically includes:
- Executive summary — Overview of detected activity
- PhantomID activity — Which identities were contacted and when
- Communication logs — Detailed call, SMS, and email records
- Threat actor profiles — Identified threat actors and their activity
- Timeline — Chronological view of all events
- Charts — Call volume over time, activity distribution
Creating a Report
- Navigate to Forensics
- Apply your desired filters (date range, affiliation, specific PhantomIDs)
- Click Generate Report
- The report is generated as an HTML file that can be:
- Viewed in a browser
- Saved as PDF
- Shared with stakeholders
Data Export
For custom analysis beyond the built-in reports:
- Snowflake / BigQuery export — Push forensic data to your data warehouse for custom SQL queries and BI dashboards
- Webhook data — Configure webhooks to receive real-time forensic events in your own systems